Your complete workspace for energy and emissions reporting
Create, customise and automate reports with branded templates, real time data and effortless sharing that turn energy and emissions insights into clear actionable outcomes.
Align your reporting with gold-standard energy & sustainability protocols
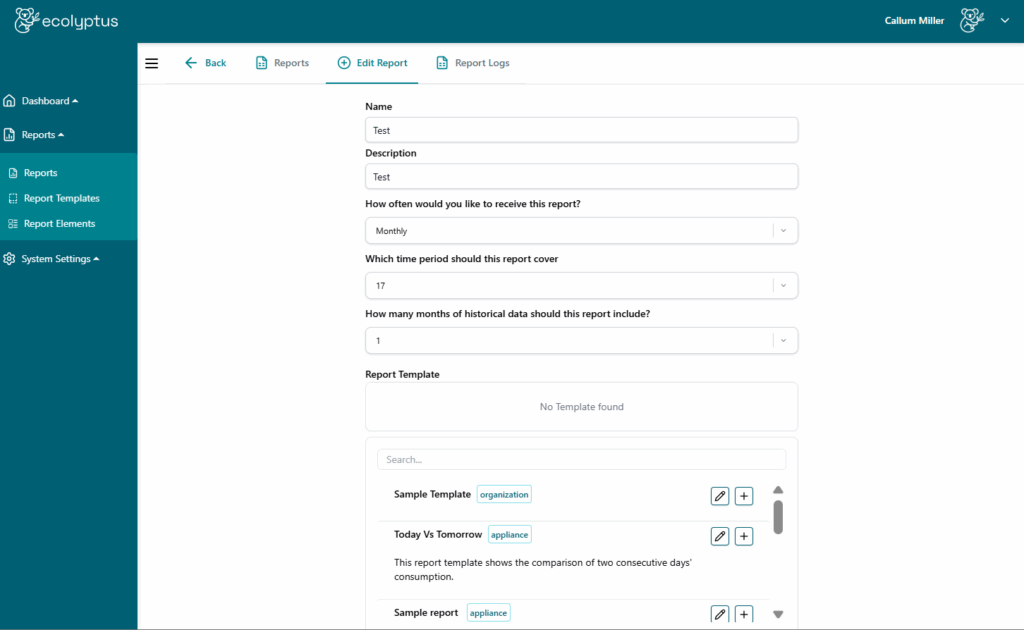
Create and customise reports
Effortlessly generate new reports by selecting your preferred frequency, choosing historical date ranges, and applying pre-built templates. Add your own branding for a professional finish that keeps every report consistent, insightful, and client-ready.
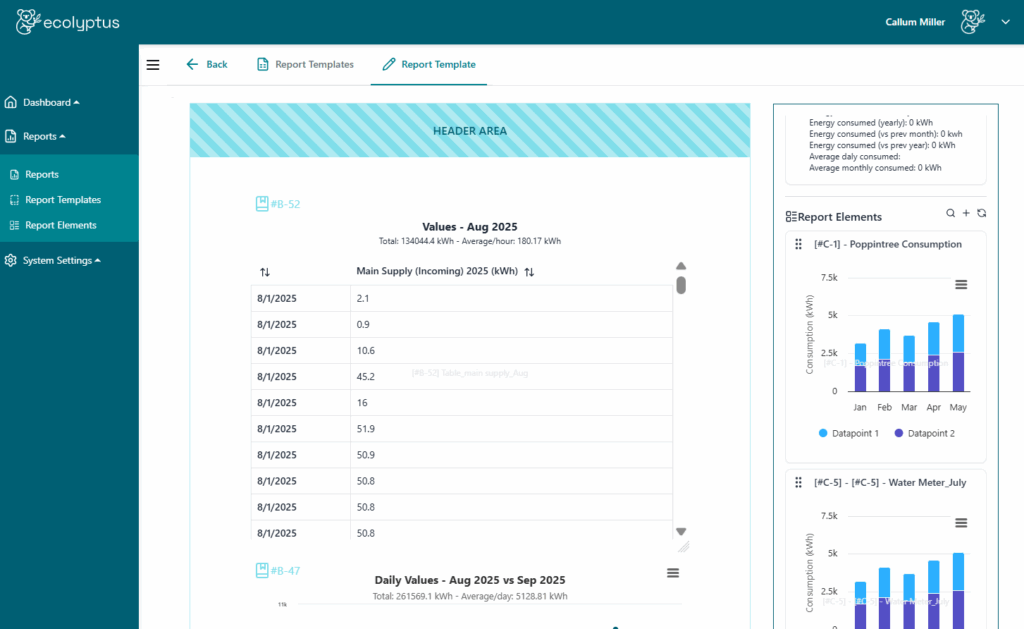
Custom report templates
Build tailored report templates through a user-friendly drag-and-drop interface. Start from the pre-built report library, customise layouts and metrics, and create reusable templates that deliver consistent, professional reports every time.
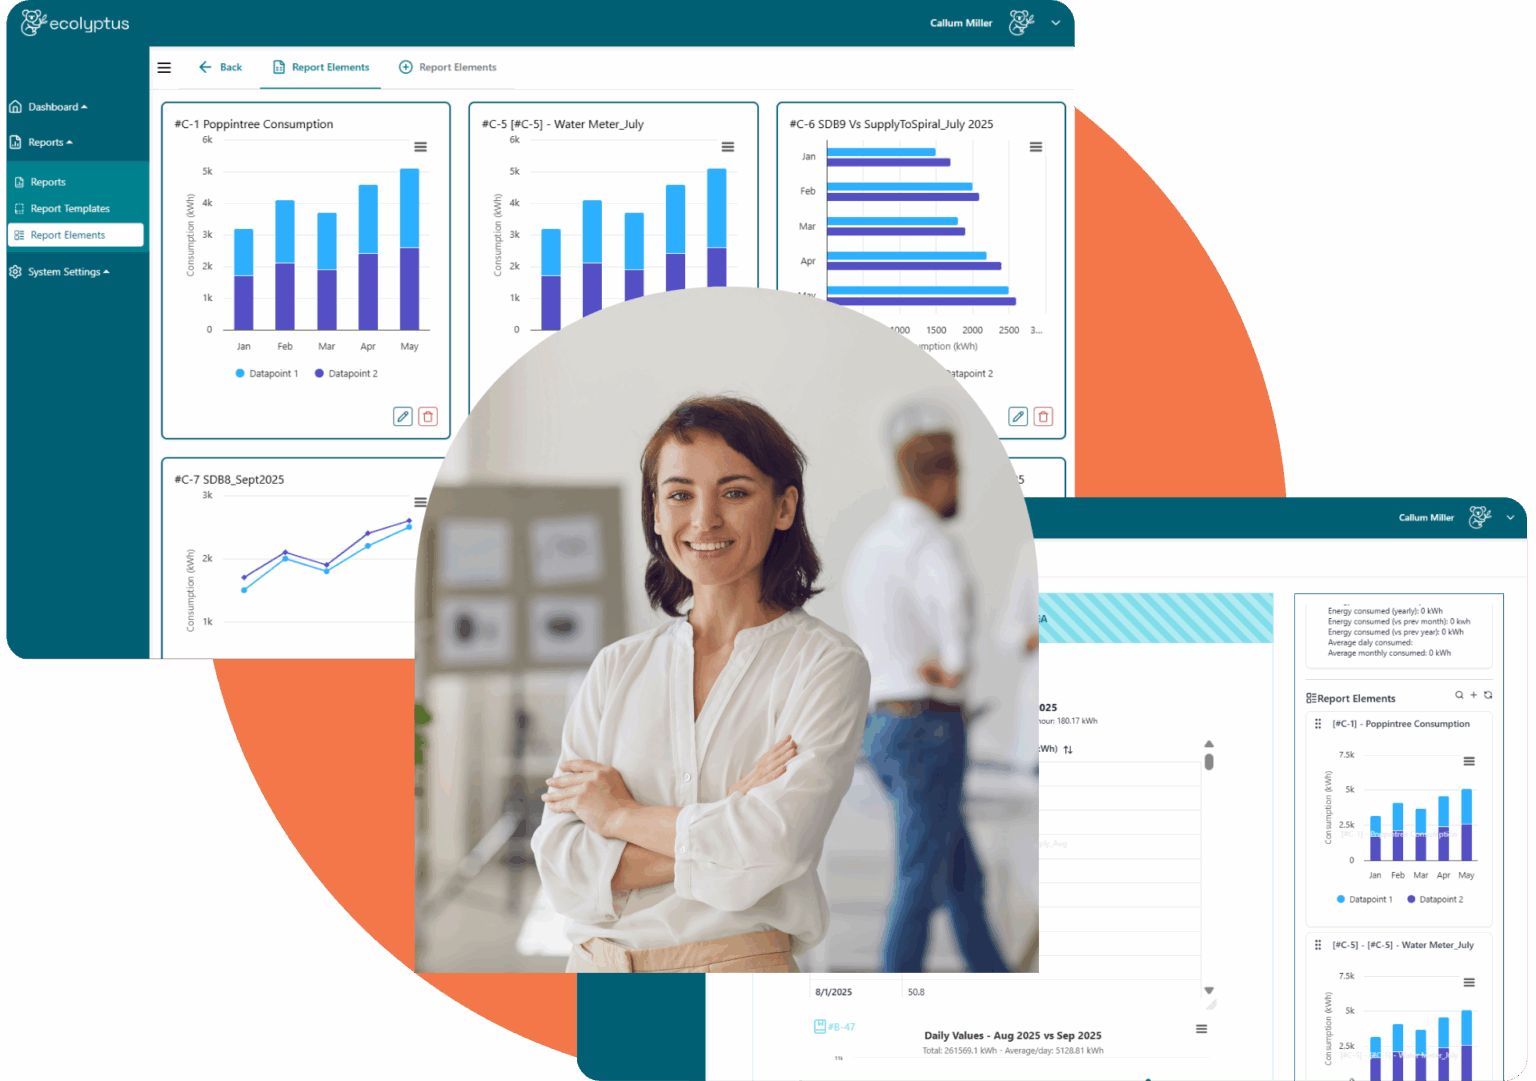
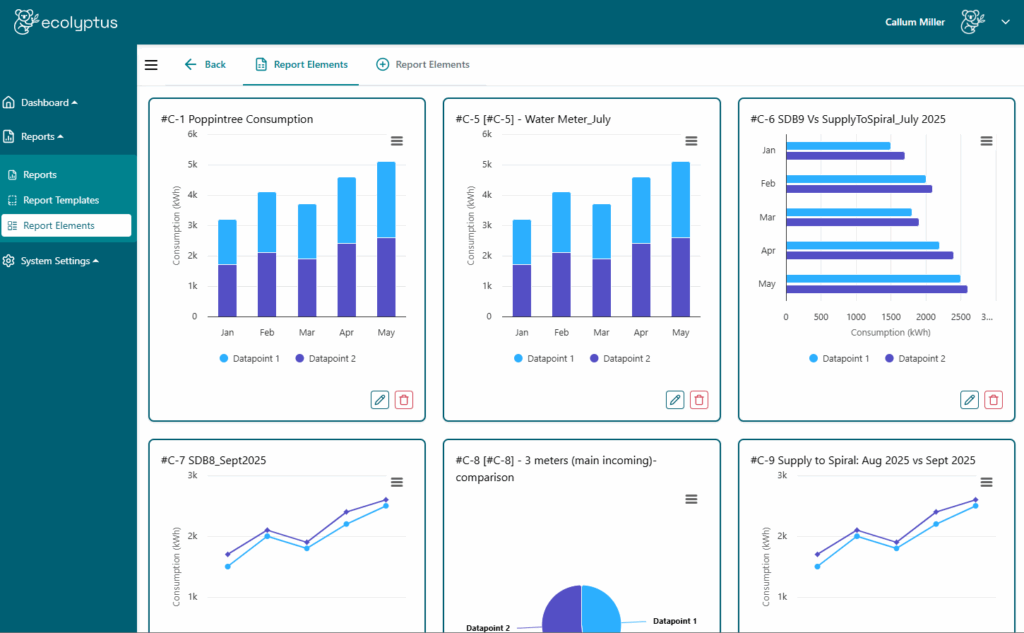
Reusable report elements
Design and save your favourite charts and tables as report elements that can be easily inserted into templates from your report library. Streamline your workflow and maintain visual consistency across every report you deliver.
Ready to take your energy and sustainability reporting to the next level?